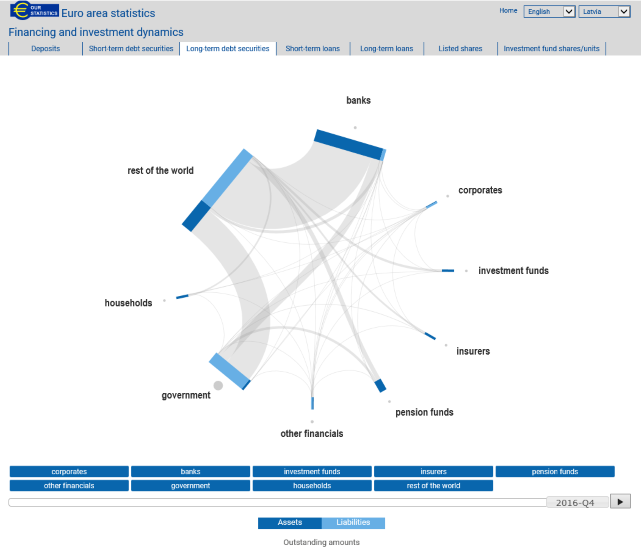
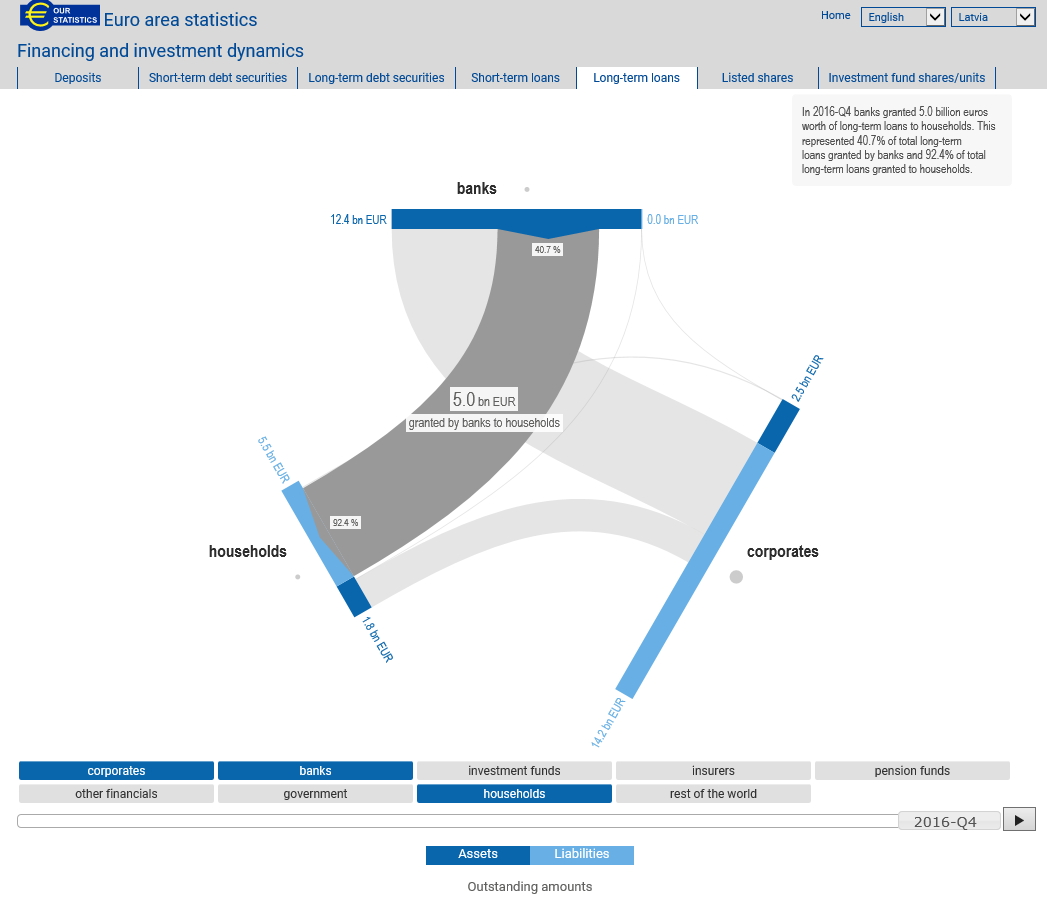
The visualisation presents the financial interconnectedness within and between institutional sectors, and between them and the rest of the world. Users can select individual financial instruments, sectors, country and time dimensions to better understand who is financing whom, and who his investing where within the economy.
The bars for each sector show the assets and liabilities of a given sector for a given instrument with different coloring. Aggregated positions within a sector are identified next to the respective sector heading. The arrows indicate the positions with other sectors.
The data shown in the network graph are taken from the quarterly financial accounts, which provide information on certain financial assets and liabilities. Quarterly financial accounts statistics of Latvia providing a complete account of all financial assets and liabilities could be found in Latvijas Banka's statistical database https://statdb.bank.lv/lb/Data.aspx?id=197